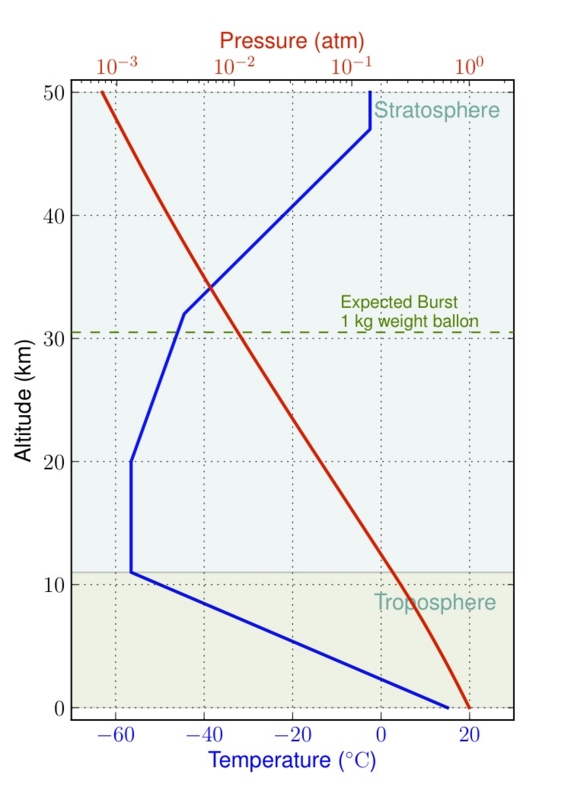
Matplotlib (python) で 2 つの X 軸をもつプロットを描く。
某「風船衛星たんぽぽ」プロジェクトのために、
地表から 40 km くらいまでの大気温度と大気圧をプロットしてみた。
Python Matplotlib で X 軸が 2 つの場合のプロットの例になっているので、
メモ代わりにここに書き留めておきます。
データは1976 年の U.S. Standard Atmosphere をダウンロードしています。
http://www.digitaldutch.com/atmoscalc/
ちなみに、1 kg の風船気球だと破裂するのは 30 km 付近。
ここまでの温度(青線)は対流圏(Troposphere)を超える成層圏(Stratosphere)の
10-20 km 付近で最も低くなり -57 ℃ 程度まで低下します。
それより高度が高くなると温度は上がっていく。
AA (単三) battery だと温度保証は -40 ℃ 以上なので、この 10-20 km 付近では
10~20 ℃分くらいは外気に対して保温する必要があるのですね。箱とホッカイロで
保温できると思いますが、このあたりには注意が必要みたいです。
以下、ソースコード。
#!/usr/bin/env python
# 1976 U.S. Standard atmosphere calcurator
# http://www.digitaldutch.com/atmoscalc/

import matplotlib.pyplot as plt
from matplotlib import rc
rc('text', usetex=True)
rc('font',**{'family':'sans-serif','sans-serif':['Helvetica'],
             'size':'14'})

altitude = []
temperature = []
pressure = []
for line in open("US_Standard_Atmosphere_1976_50pt.table"):
    col = line.split()
    if col[0] != '#':
        altitude.append(col[0])
        temperature.append(col[1])
        pressure.append(col[2])

ylim_low = -1
ylim_high = 51

fig = plt.figure(figsize=(5,7))
ax1 = fig.add_subplot(111)
ax1.plot(temperature, altitude, 'b-', lw=2)
ax1.set_xlabel('Temperature (${}^\circ\mathrm{C}$)', color='b')
ax1.set_ylabel('Altitude (km)')
ax1.grid(True)
ax1.set_xlim(-70, 30)
ax1.set_ylim(ylim_low, ylim_high)
for tl in ax1.get_xticklabels():
    tl.set_color('b')

ax2 = ax1.twiny()
ax2.plot(pressure, altitude, color='r', lw=2)
ax2.set_xscale('log')
ax2.set_xlabel('Pressure (atm)', color='r')
ax2.set_xlim(4.1e-4, 0.24e+1)
ax2.set_ylim(ylim_low, ylim_high)
for tl in ax2.get_xticklabels():
    tl.set_color('r')

plt.axhline(y=30.5, linewidth=1, color='g', ls='--')
plt.axhspan(0.0, 11.0, facecolor='g', alpha=0.1)
plt.axhspan(11.0, 50.0, facecolor='#3EA99F', alpha=0.1)
plt.text(0.08, 32.5, 'Expected Burst',
         color='g', size=11)
plt.text(0.08, 31.0, '1 kg weight ballon',
         color='g', size=11)
plt.text(0.155, 8, 'Troposphere', color='#3EA99F', zorder=1)
plt.text(0.155, 48, 'Stratosphere', color='#3EA99F', zorder=2)

fig.savefig("us_standard_atmosphere_1976.pdf")
ここでの標準大気のデータフォーマットは以下の通り。
# 1976 standard atmosphere calculator
# http://www.digitaldutch.com/atmoscalc/
# Altitude Temperature Pressure		Density Speed of sound
# [km]	   [Celsius]   [atmosphere] 	[kg/m3] [m/s]
0	15	1      		1.225		340.294065
1	8.5	0.886993	1.111643	336.434048
2	2	0.784557	1.00649		332.529226
3	-4.5	0.691918	0.909122	328.578003
4	-11	0.608342	0.819129	324.578683
5	-17.5	0.533135	0.736116	320.529467
